Debugging and Monitoring
Applications that use LLMs have some challenges that are well known and understood: LLMs are slow, unreliable and expensive.
These applications also have some challenges that most developers have encountered much less often: LLMs are fickle and non-deterministic. Subtle changes in a prompt can completely change a model's performance, and there's no EXPLAIN query you can run to understand why.
Warning
From a software engineers point of view, you can think of LLMs as the worst database you've ever heard of, but worse.
If LLMs weren't so bloody useful, we'd never touch them.
To build successful applications with LLMs, we need new tools to understand both model performance, and the behavior of applications that rely on them.
LLM Observability tools that just let you understand how your model is performing are useless: making API calls to an LLM is easy, it's building that into an application that's hard.
Pydantic Logfire
Pydantic Logfire is an observability platform developed by the team who created and maintain Pydantic and PydanticAI. Logfire aims to let you understand your entire application: Gen AI, classic predictive AI, HTTP traffic, database queries and everything else a modern application needs, all using OpenTelemetry.
Pydantic Logfire is a commercial product
Logfire is a commercially supported, hosted platform with an extremely generous and perpetual free tier. You can sign up and start using Logfire in a couple of minutes.
PydanticAI has built-in (but optional) support for Logfire. That means if the logfire package is installed and configured and agent instrumentation is enabled then detailed information about agent runs is sent to Logfire. Otherwise there's virtually no overhead and nothing is sent.
Here's an example showing details of running the Weather Agent in Logfire:
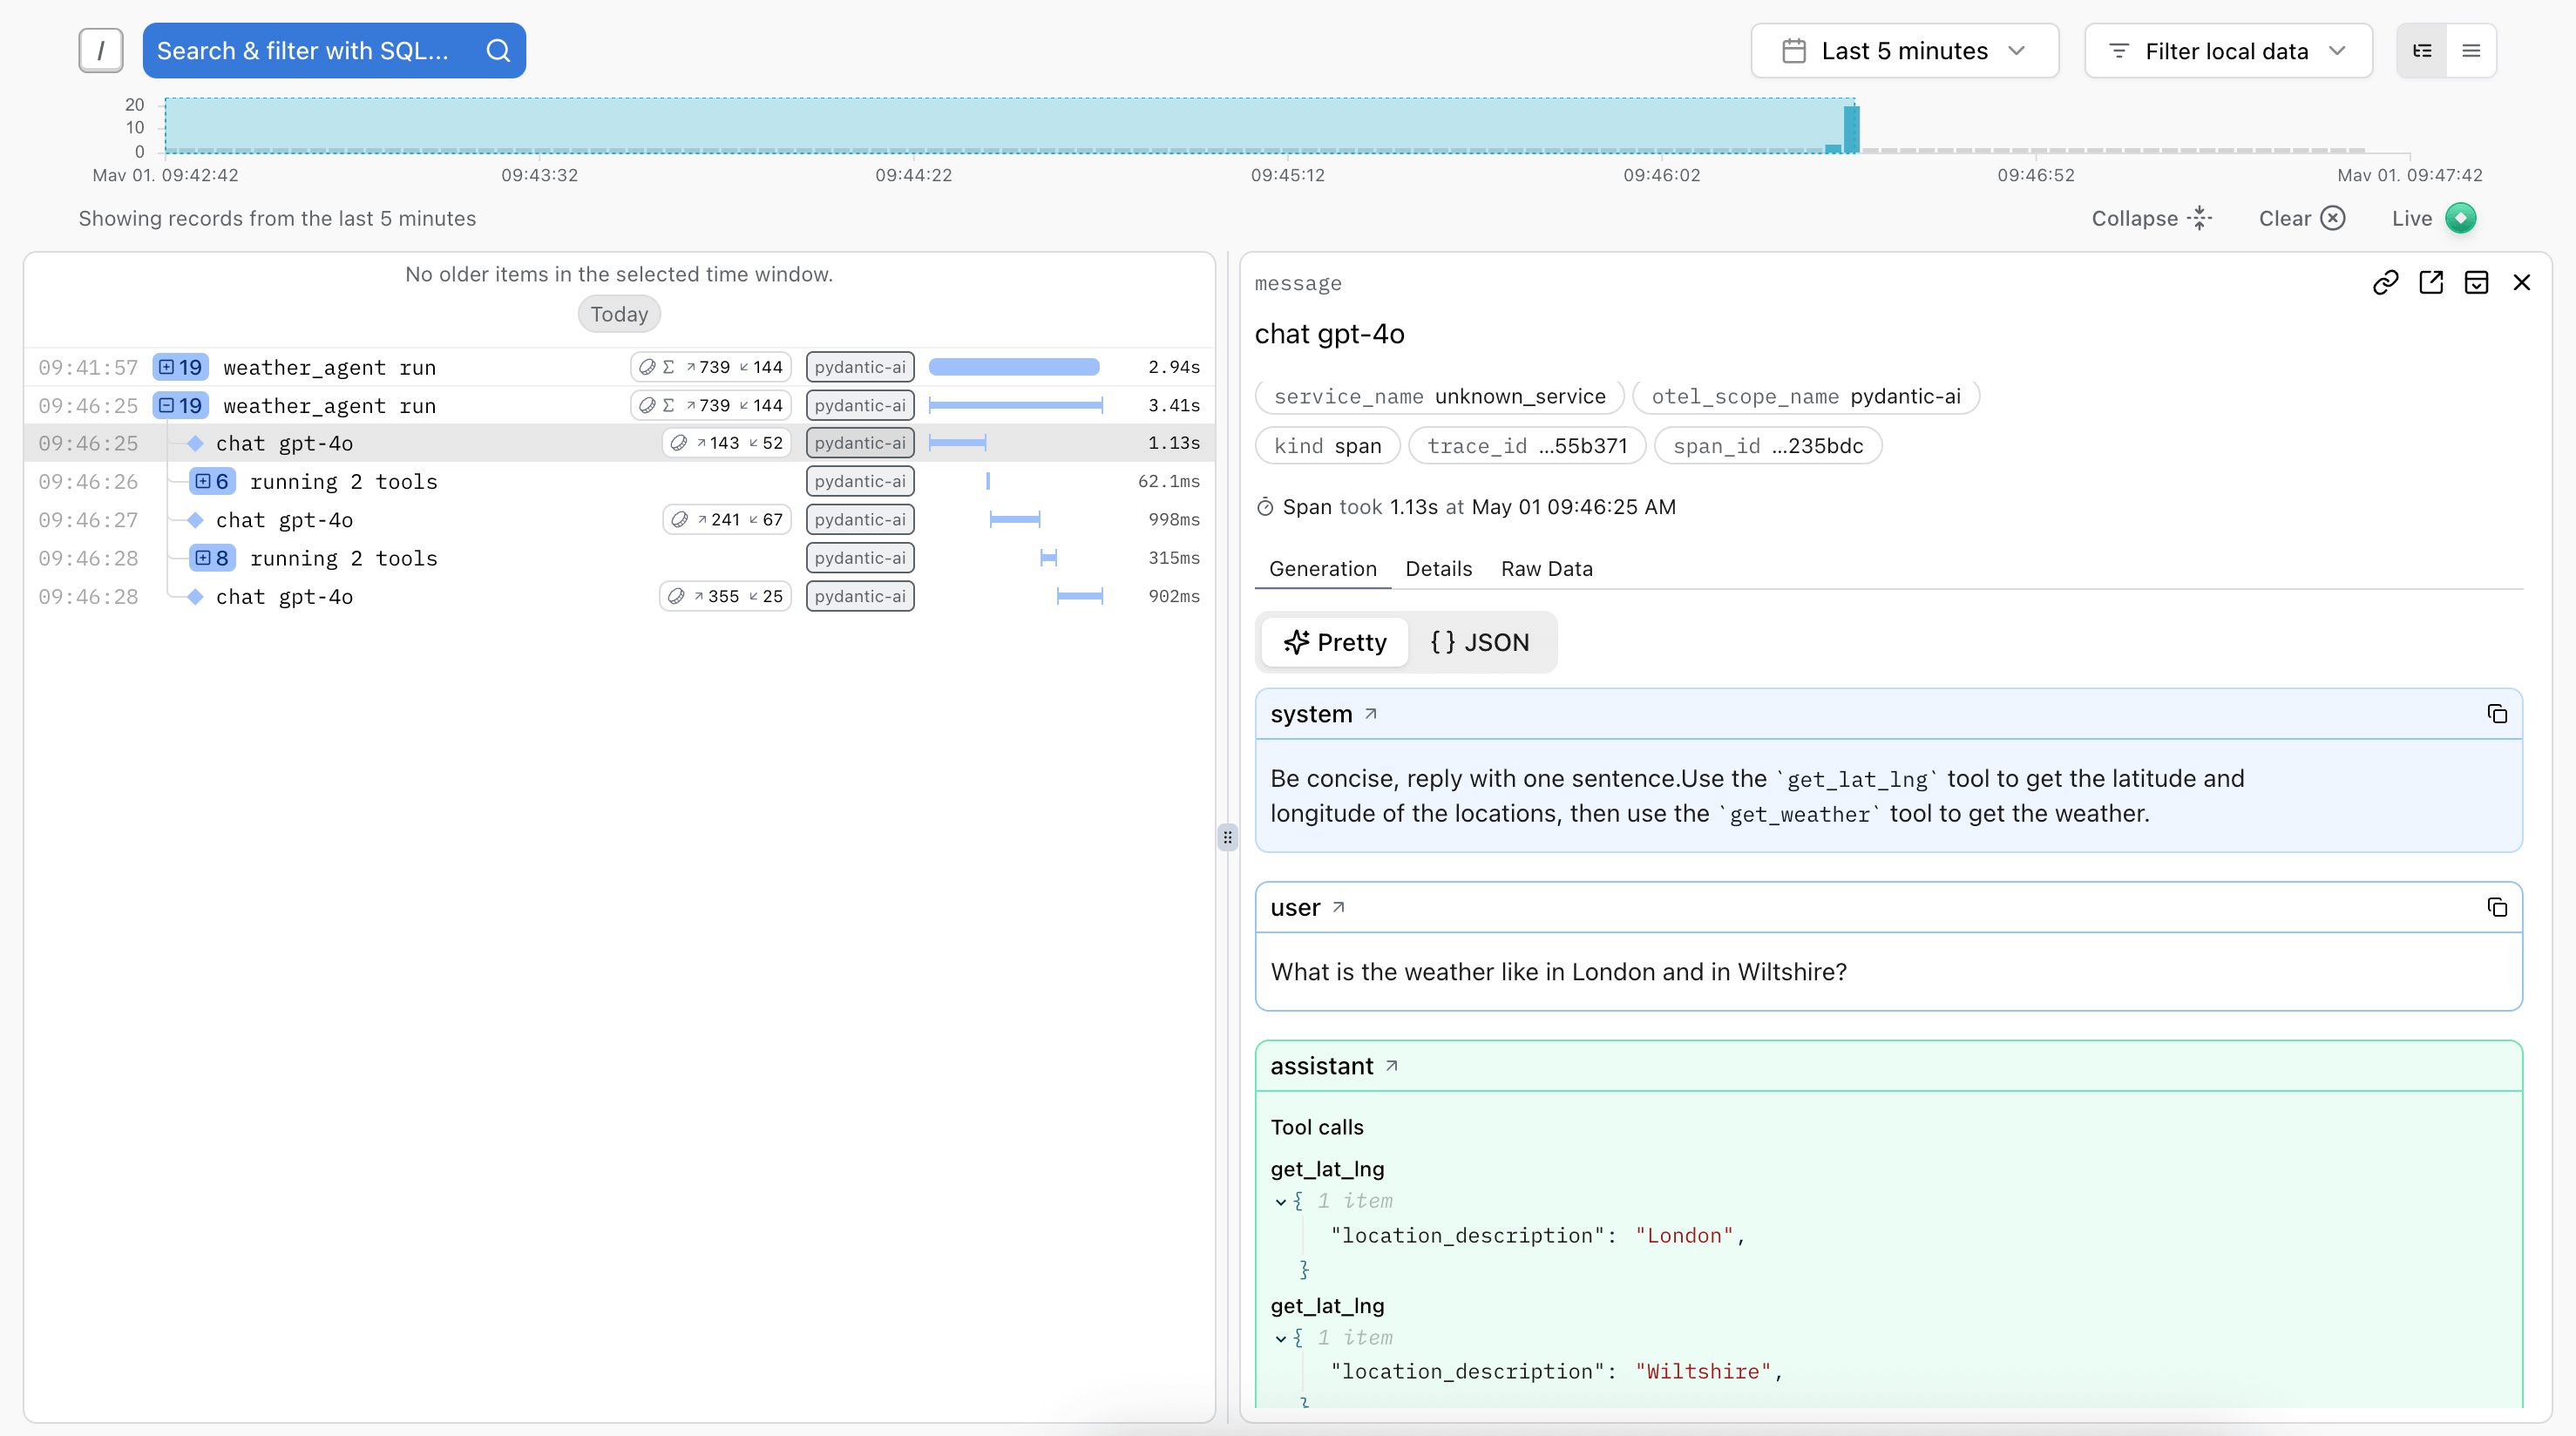
A trace is generated for the agent run, and spans are emitted for each model request and tool call.
Using Logfire
To use logfire, you'll need a logfire account, and the logfire Python SDK installed:
pip install "pydantic-ai[logfire]"
uv add "pydantic-ai[logfire]"
Then authenticate your local environment with logfire:
logfire auth
uv run logfire auth
And configure a project to send data to:
logfire projects new
uv run logfire projects new
(Or use an existing project with logfire projects use)
This will write to a .logfire directory in the current working directory, which the Logfire SDK will use for configuration at run time.
With that, you can start using logfire to instrument PydanticAI code:
import logfire

from pydantic_ai import Agent

logfire.configure()  # (1)!
logfire.instrument_pydantic_ai()  # (2)!

agent = Agent('openai:gpt-4o', instructions='Be concise, reply with one sentence.')
result = agent.run_sync('Where does "hello world" come from?')  # (3)!
print(result.output)
"""
The first known use of "hello, world" was in a 1974 textbook about the C programming language.
"""
logfire.configure()configures the SDK, by default it will find the write token from the.logfiredirectory, but you can also pass a token directly.logfire.instrument_pydantic_ai()enables instrumentation of PydanticAI.- Since we've enabled instrumentation, a trace will be generated for each run, with spans emitted for models calls and tool function execution
(This example is complete, it can be run "as is")
The logfire documentation has more details on how to use logfire, including how to instrument other libraries like HTTPX and FastAPI.
Since Logfire is built on OpenTelemetry, you can use the Logfire Python SDK to send data to any OpenTelemetry collector.
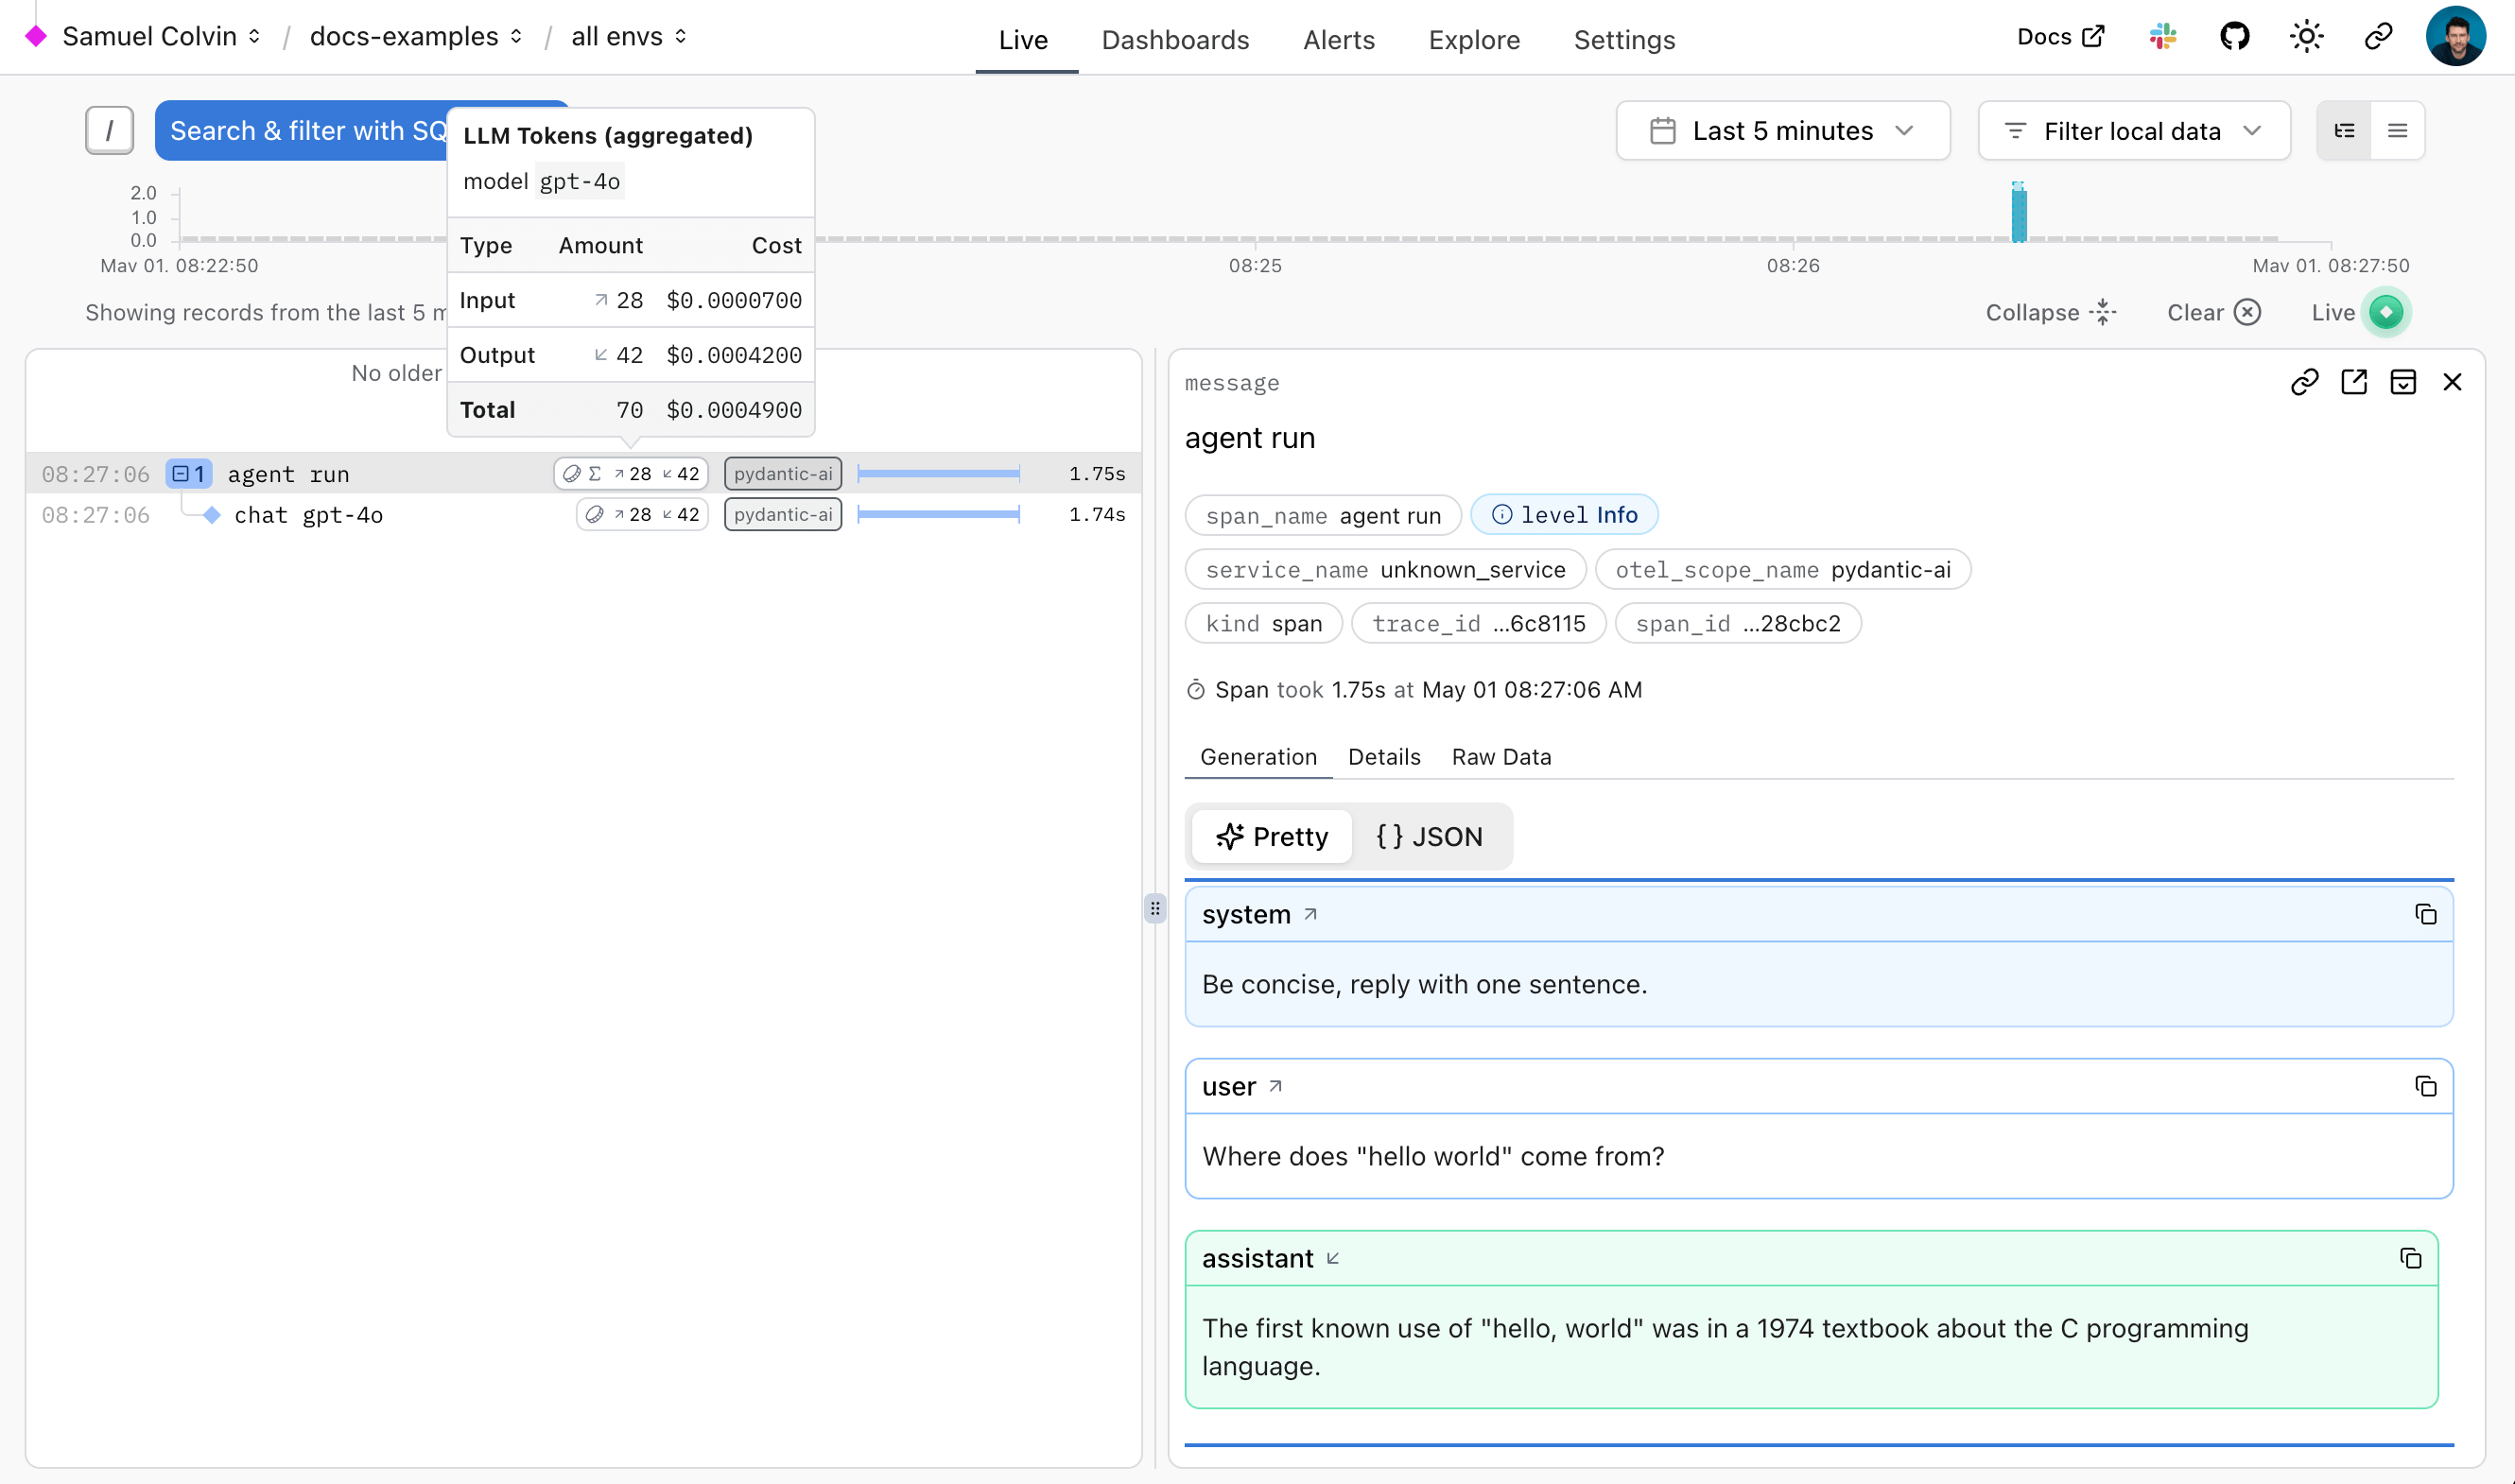
Debugging
To demonstrate how Logfire can let you visualise the flow of a PydanticAI run, here's the view you get from Logfire while running the chat app examples:
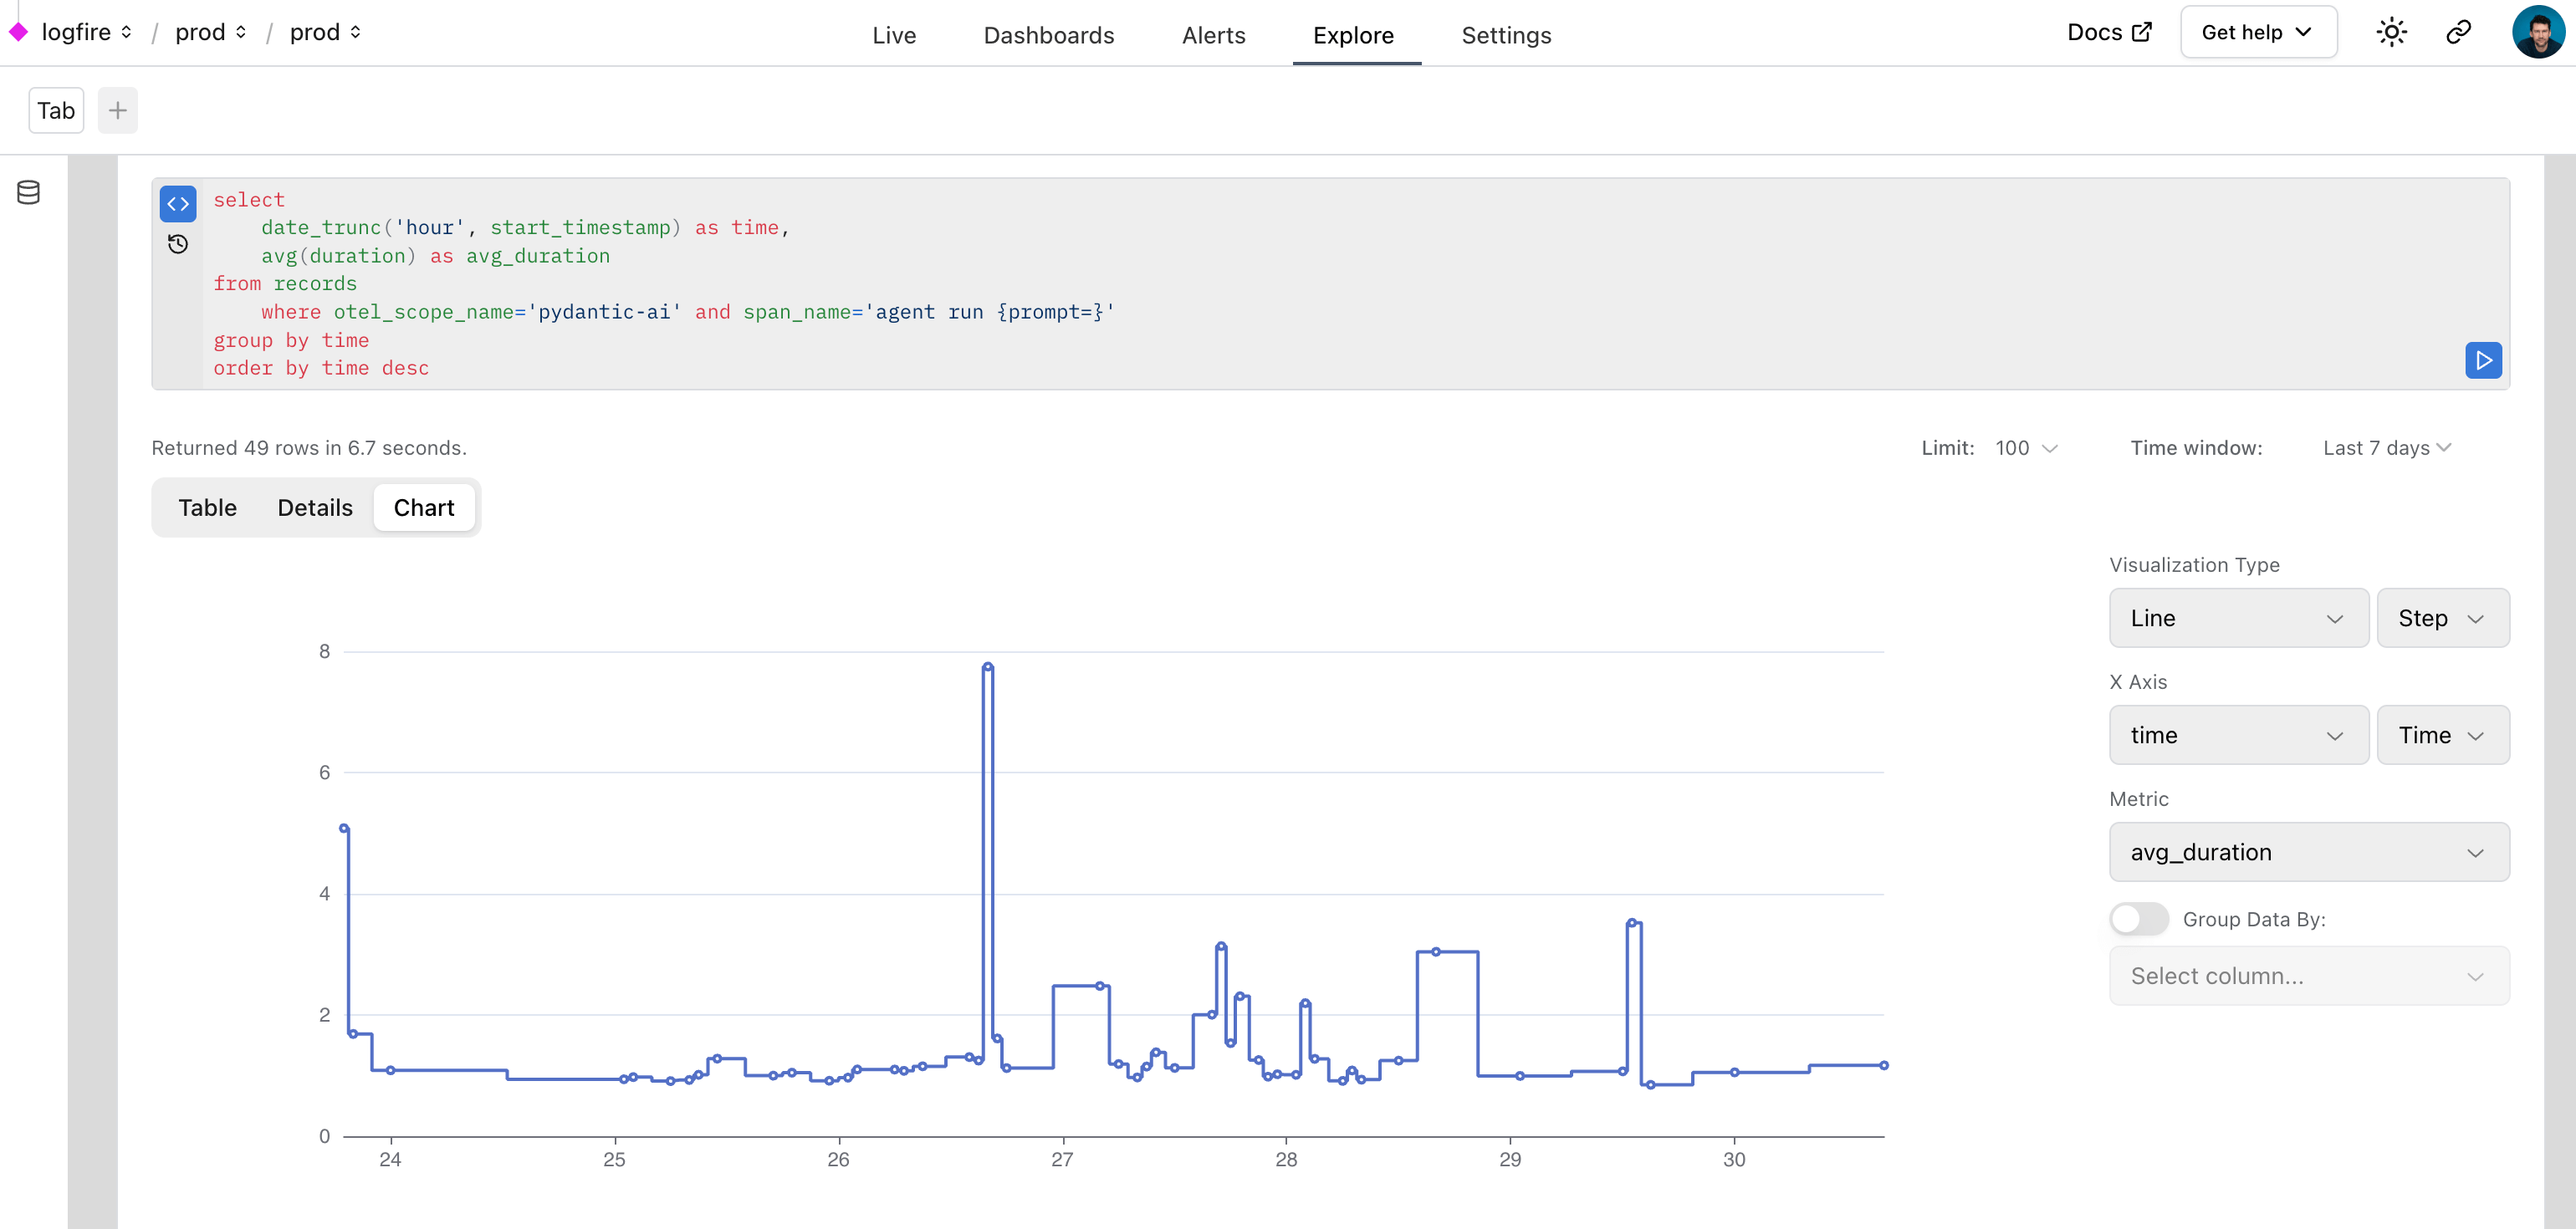
Monitoring Performance
We can also query data with SQL in Logfire to monitor the performance of an application. Here's a real world example of using Logfire to monitor PydanticAI runs inside Logfire itself:
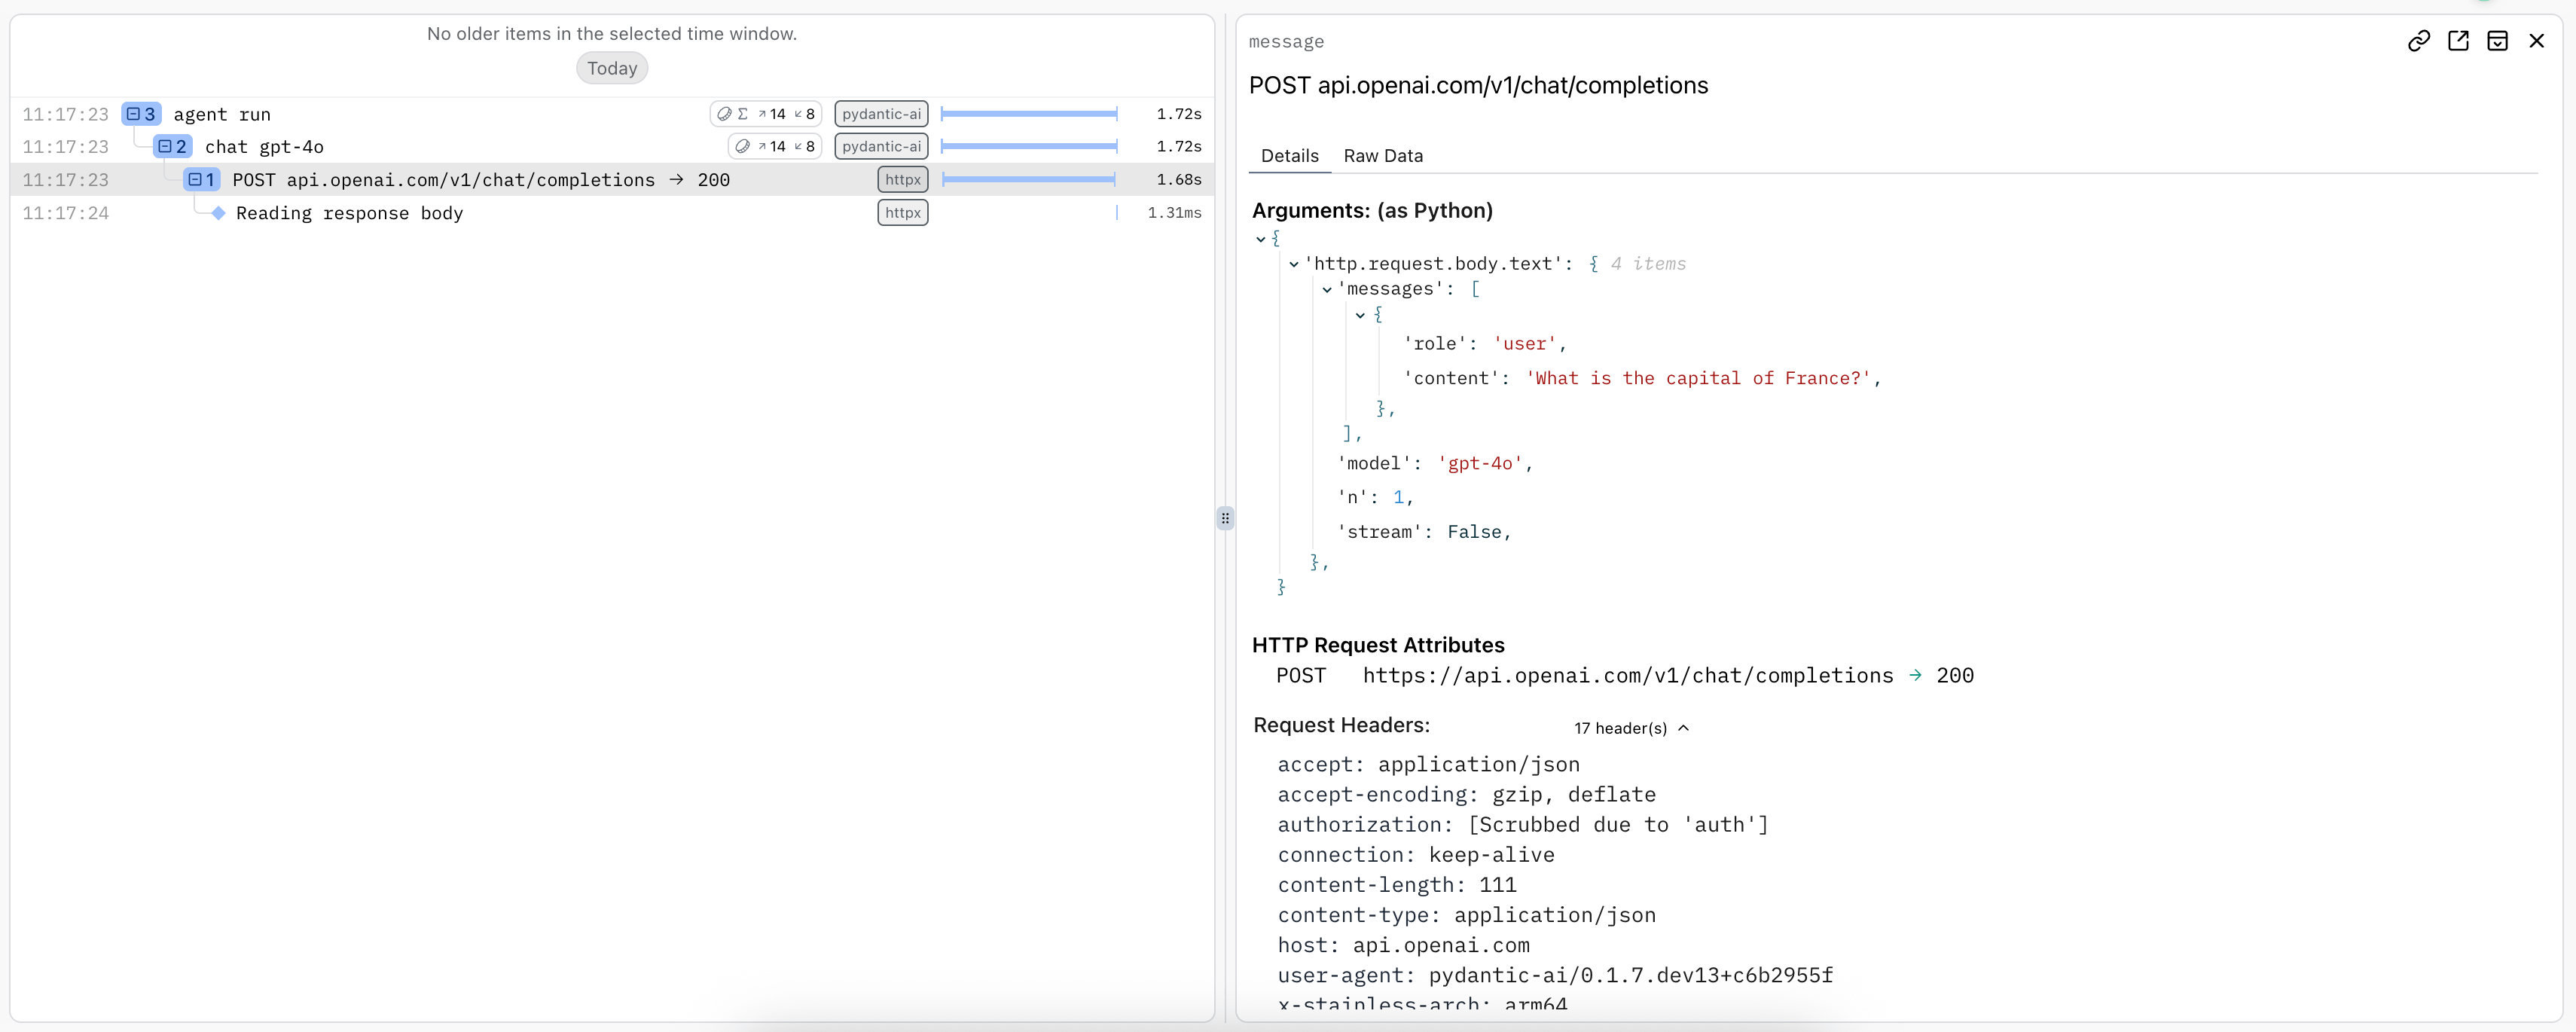
Monitoring HTTP Requests
"F**k you, show me the prompt."
As per Hamel Husain's influential 2024 blog post "Fuck You, Show Me The Prompt." (bare with the capitalization, the point is valid), it's often useful to be able to view the raw HTTP requests and responses made to model providers.
To observer raw HTTP requests made to model providers, you can use logfire's HTTPX instrumentation since all provider SDKs use the HTTPX library internally.
import logfire
from pydantic_ai import Agent
logfire.configure()
logfire.instrument_pydantic_ai()
logfire.instrument_httpx(capture_all=True) # (1)!
agent = Agent('openai:gpt-4o')
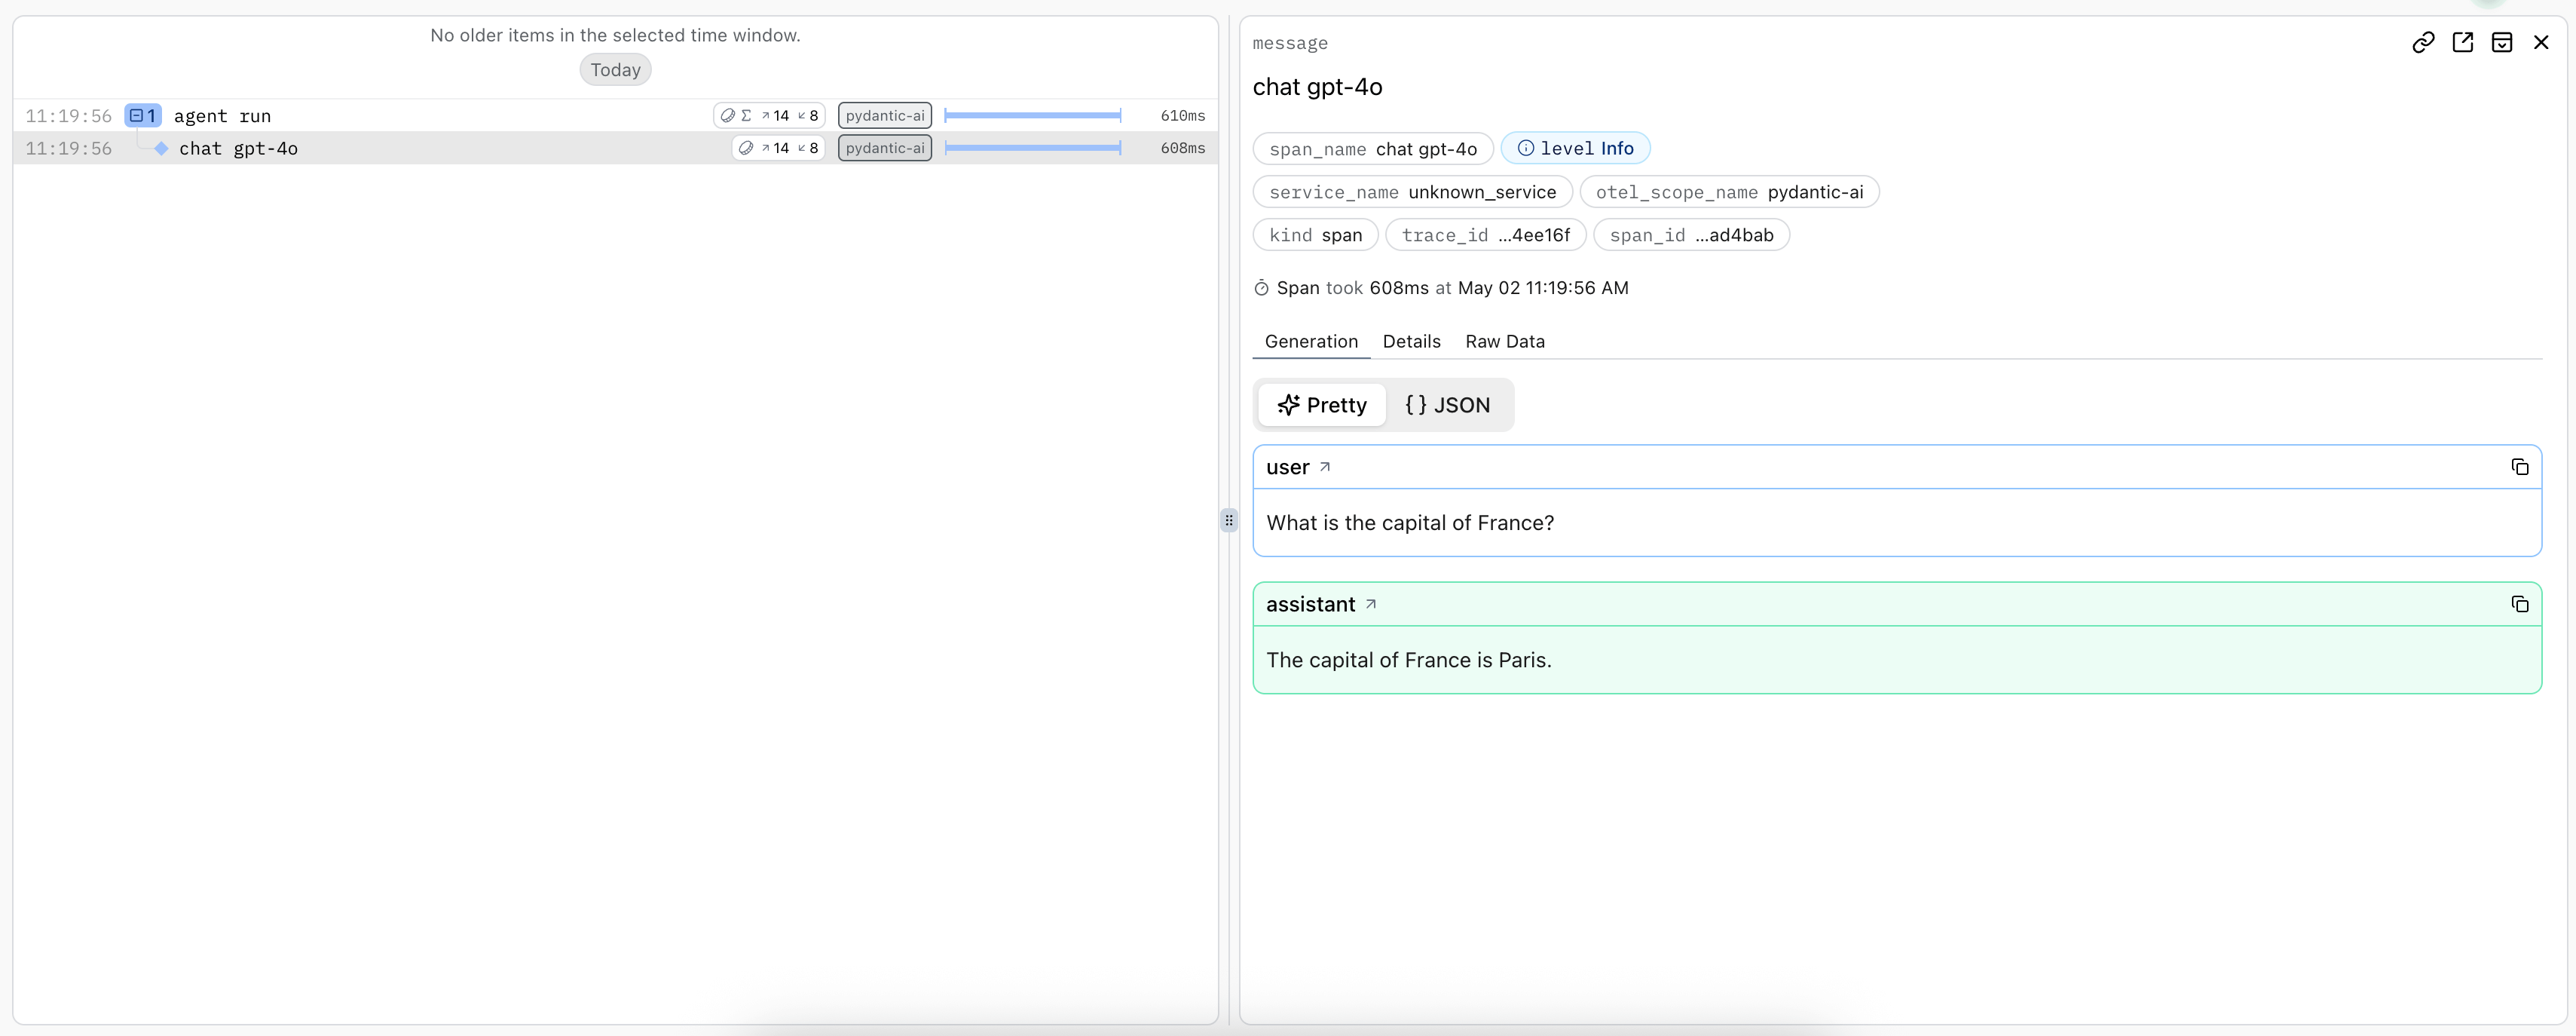
result = agent.run_sync('What is the capital of France?')
print(result.output)
#> Paris
- See the
logfire.instrument_httpxdocs more details,capture_all=Truemeans both headers and body are captured for both the request and response.
import logfire

from pydantic_ai import Agent

logfire.configure()
logfire.instrument_pydantic_ai()

agent = Agent('openai:gpt-4o')
result = agent.run_sync('What is the capital of France?')
print(result.output)
#> Paris
Using OpenTelemetry
PydanticAI's instrumentation uses OpenTelemetry, which Logfire is based on.
This means you can debug and monitor PydanticAI with any OpenTelemetry backend.
PydanticAI follows the OpenTelemetry Semantic Conventions for Generative AI systems, so while we think you'll have the best experience using the Logfire platform  , you should get the best experience possible with other platforms.
Logfire with an alternative OTel backend
You can use the Logfire SDK completely freely and send the data to any OpenTelemetry backend.
Here's an example of configuring the logfire library to send data to the excellent otel-tui — an open source terminal based OTel backend and viewer (no association with Pydantic).
Run otel-tui with docker (see the otel-tui readme for more instructions):
docker run --rm -it -p 4318:4318 --name otel-tui ymtdzzz/otel-tui:latest
then run,
import os

import logfire

from pydantic_ai import Agent

os.environ['OTEL_EXPORTER_OTLP_ENDPOINT'] = 'http://localhost:4318'  # (1)!
logfire.configure(send_to_logfire=False)  # (2)!
logfire.instrument_pydantic_ai()
logfire.instrument_httpx(capture_all=True)

agent = Agent('openai:gpt-4o')
result = agent.run_sync('What is the capital of France?')
print(result.output)
#> Paris
- Set the
OTEL_EXPORTER_OTLP_ENDPOINTenvironment variable to the URL of your OpenTelemetry backend. If you're using a backend that requires authentication, you may need to set other environment variables. Of course, these can also be set outside the process withexport OTEL_EXPORTER_OTLP_ENDPOINT=http://localhost:4318. - We configure logfire to disable sending data to the logfire otel backend itself.
Running the above code will send tracing data to otel-tui, which will display like this:
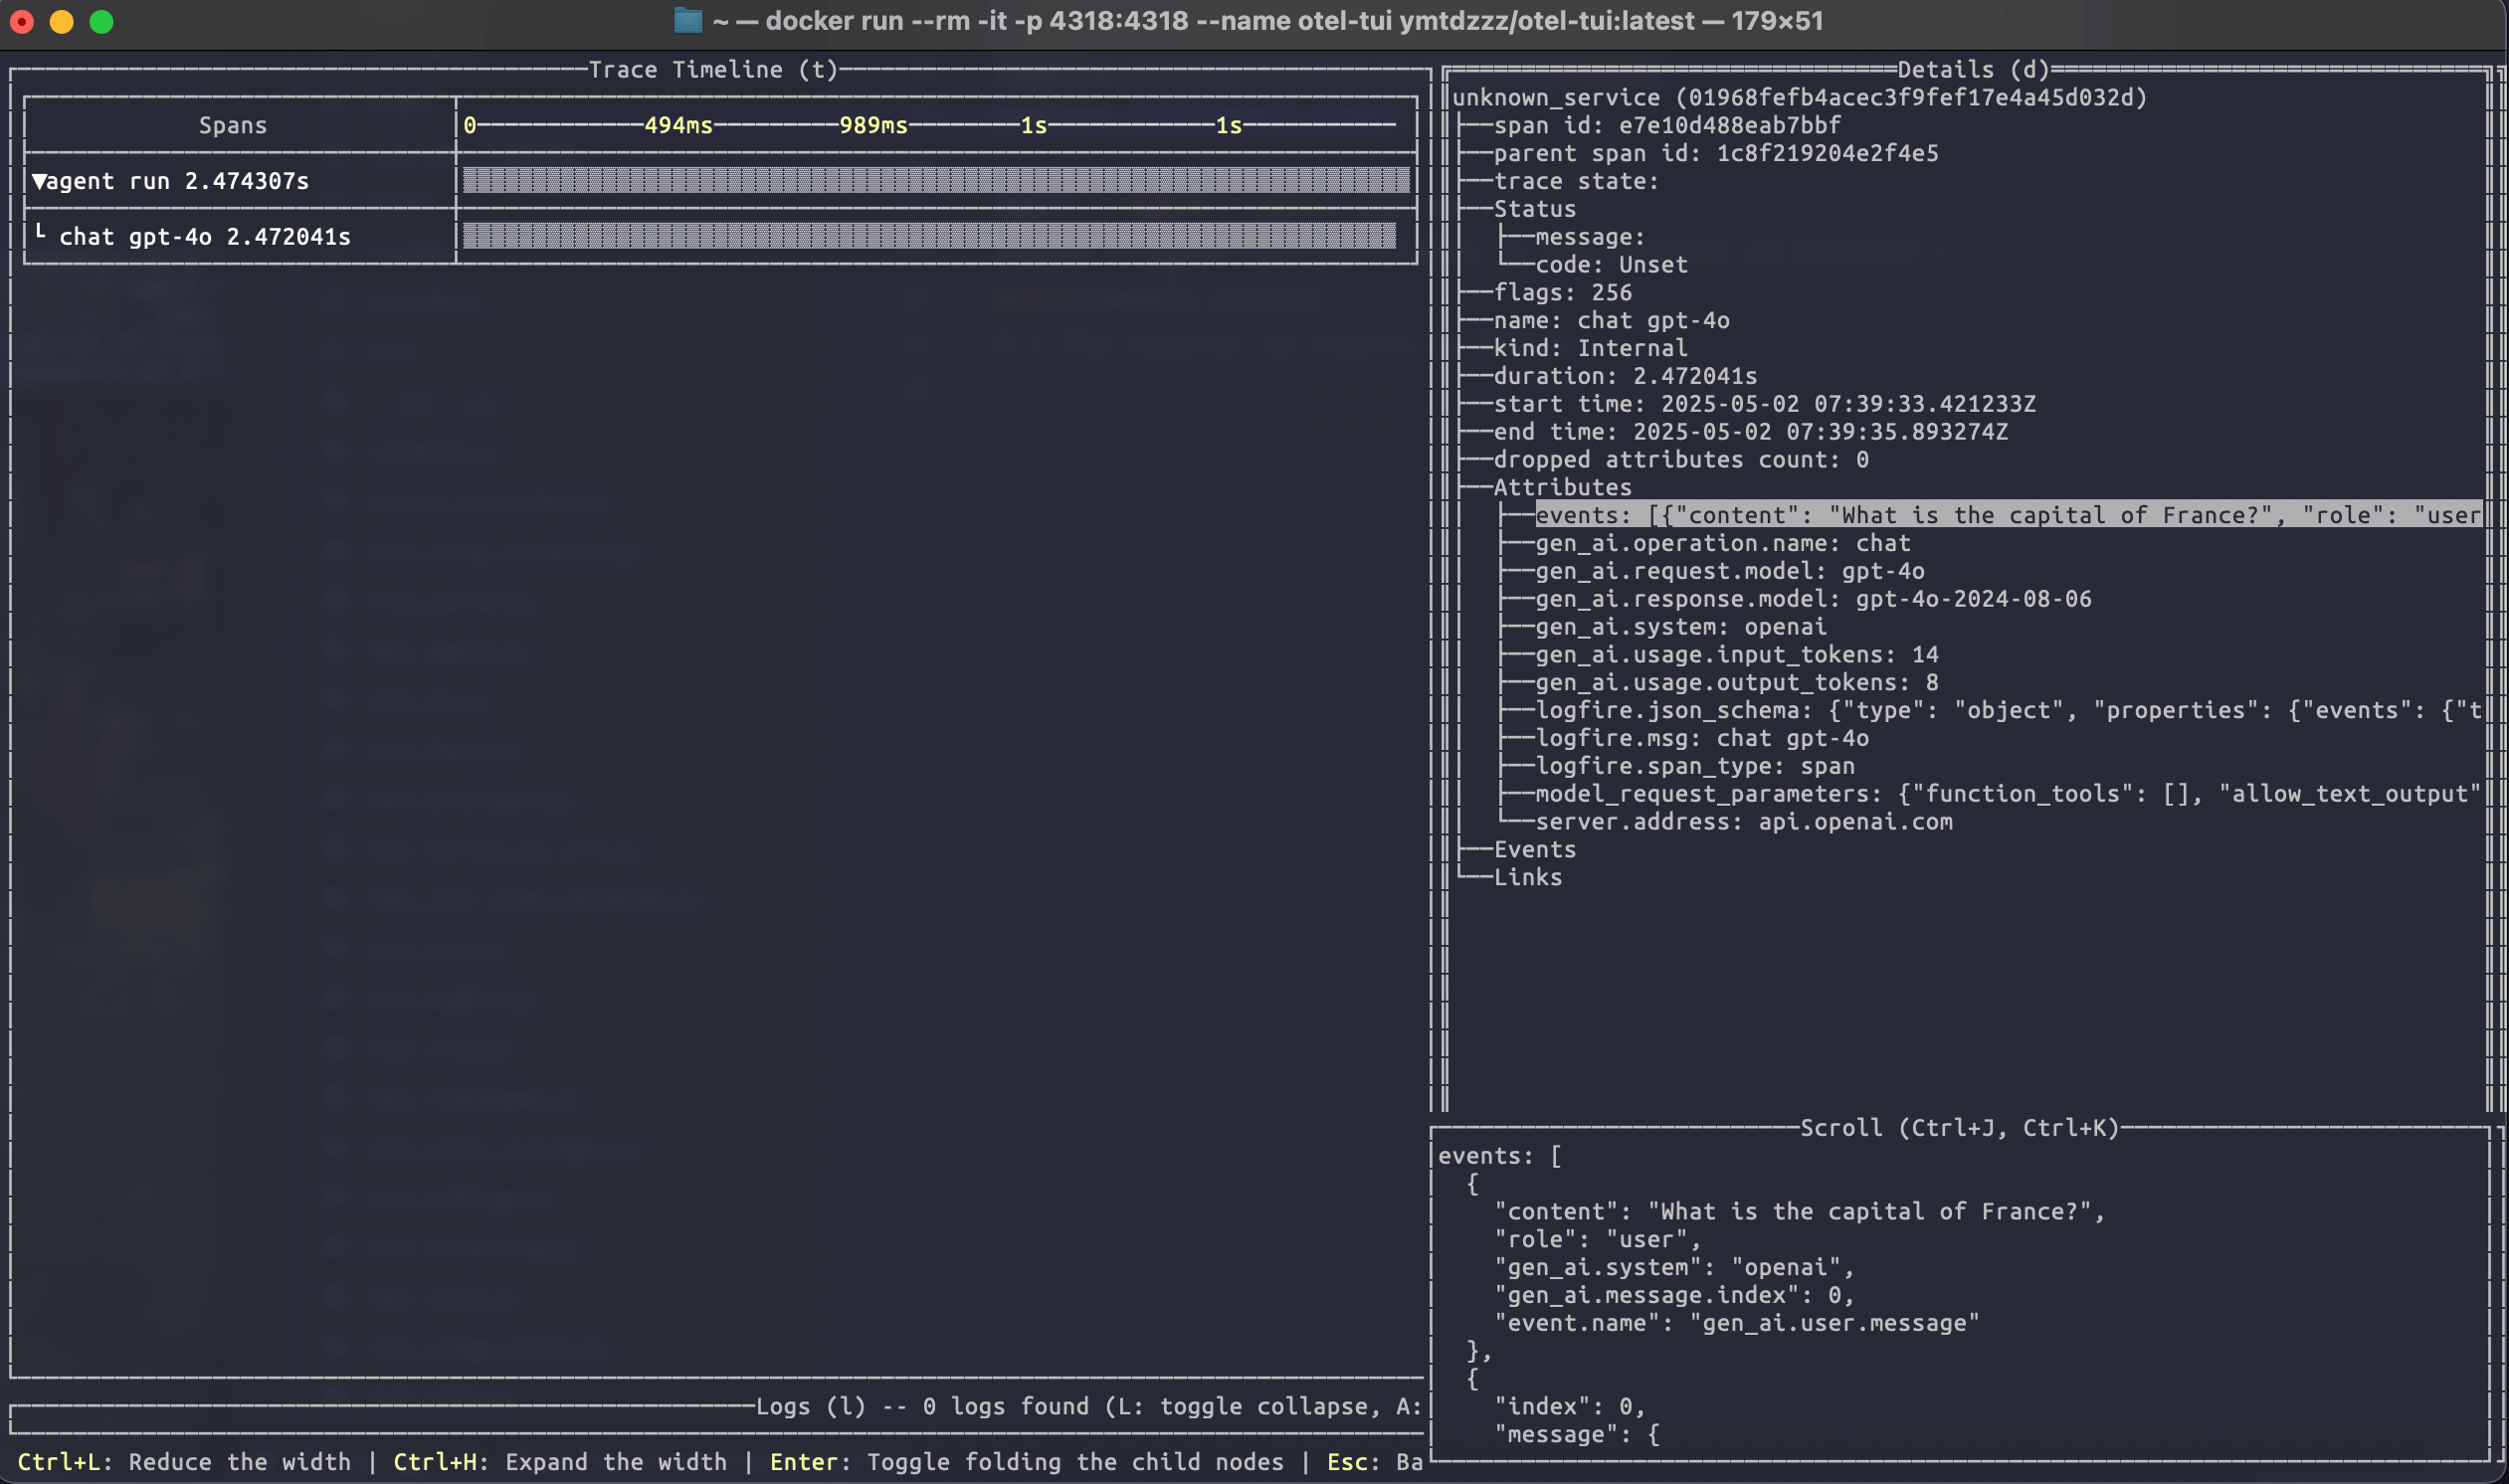
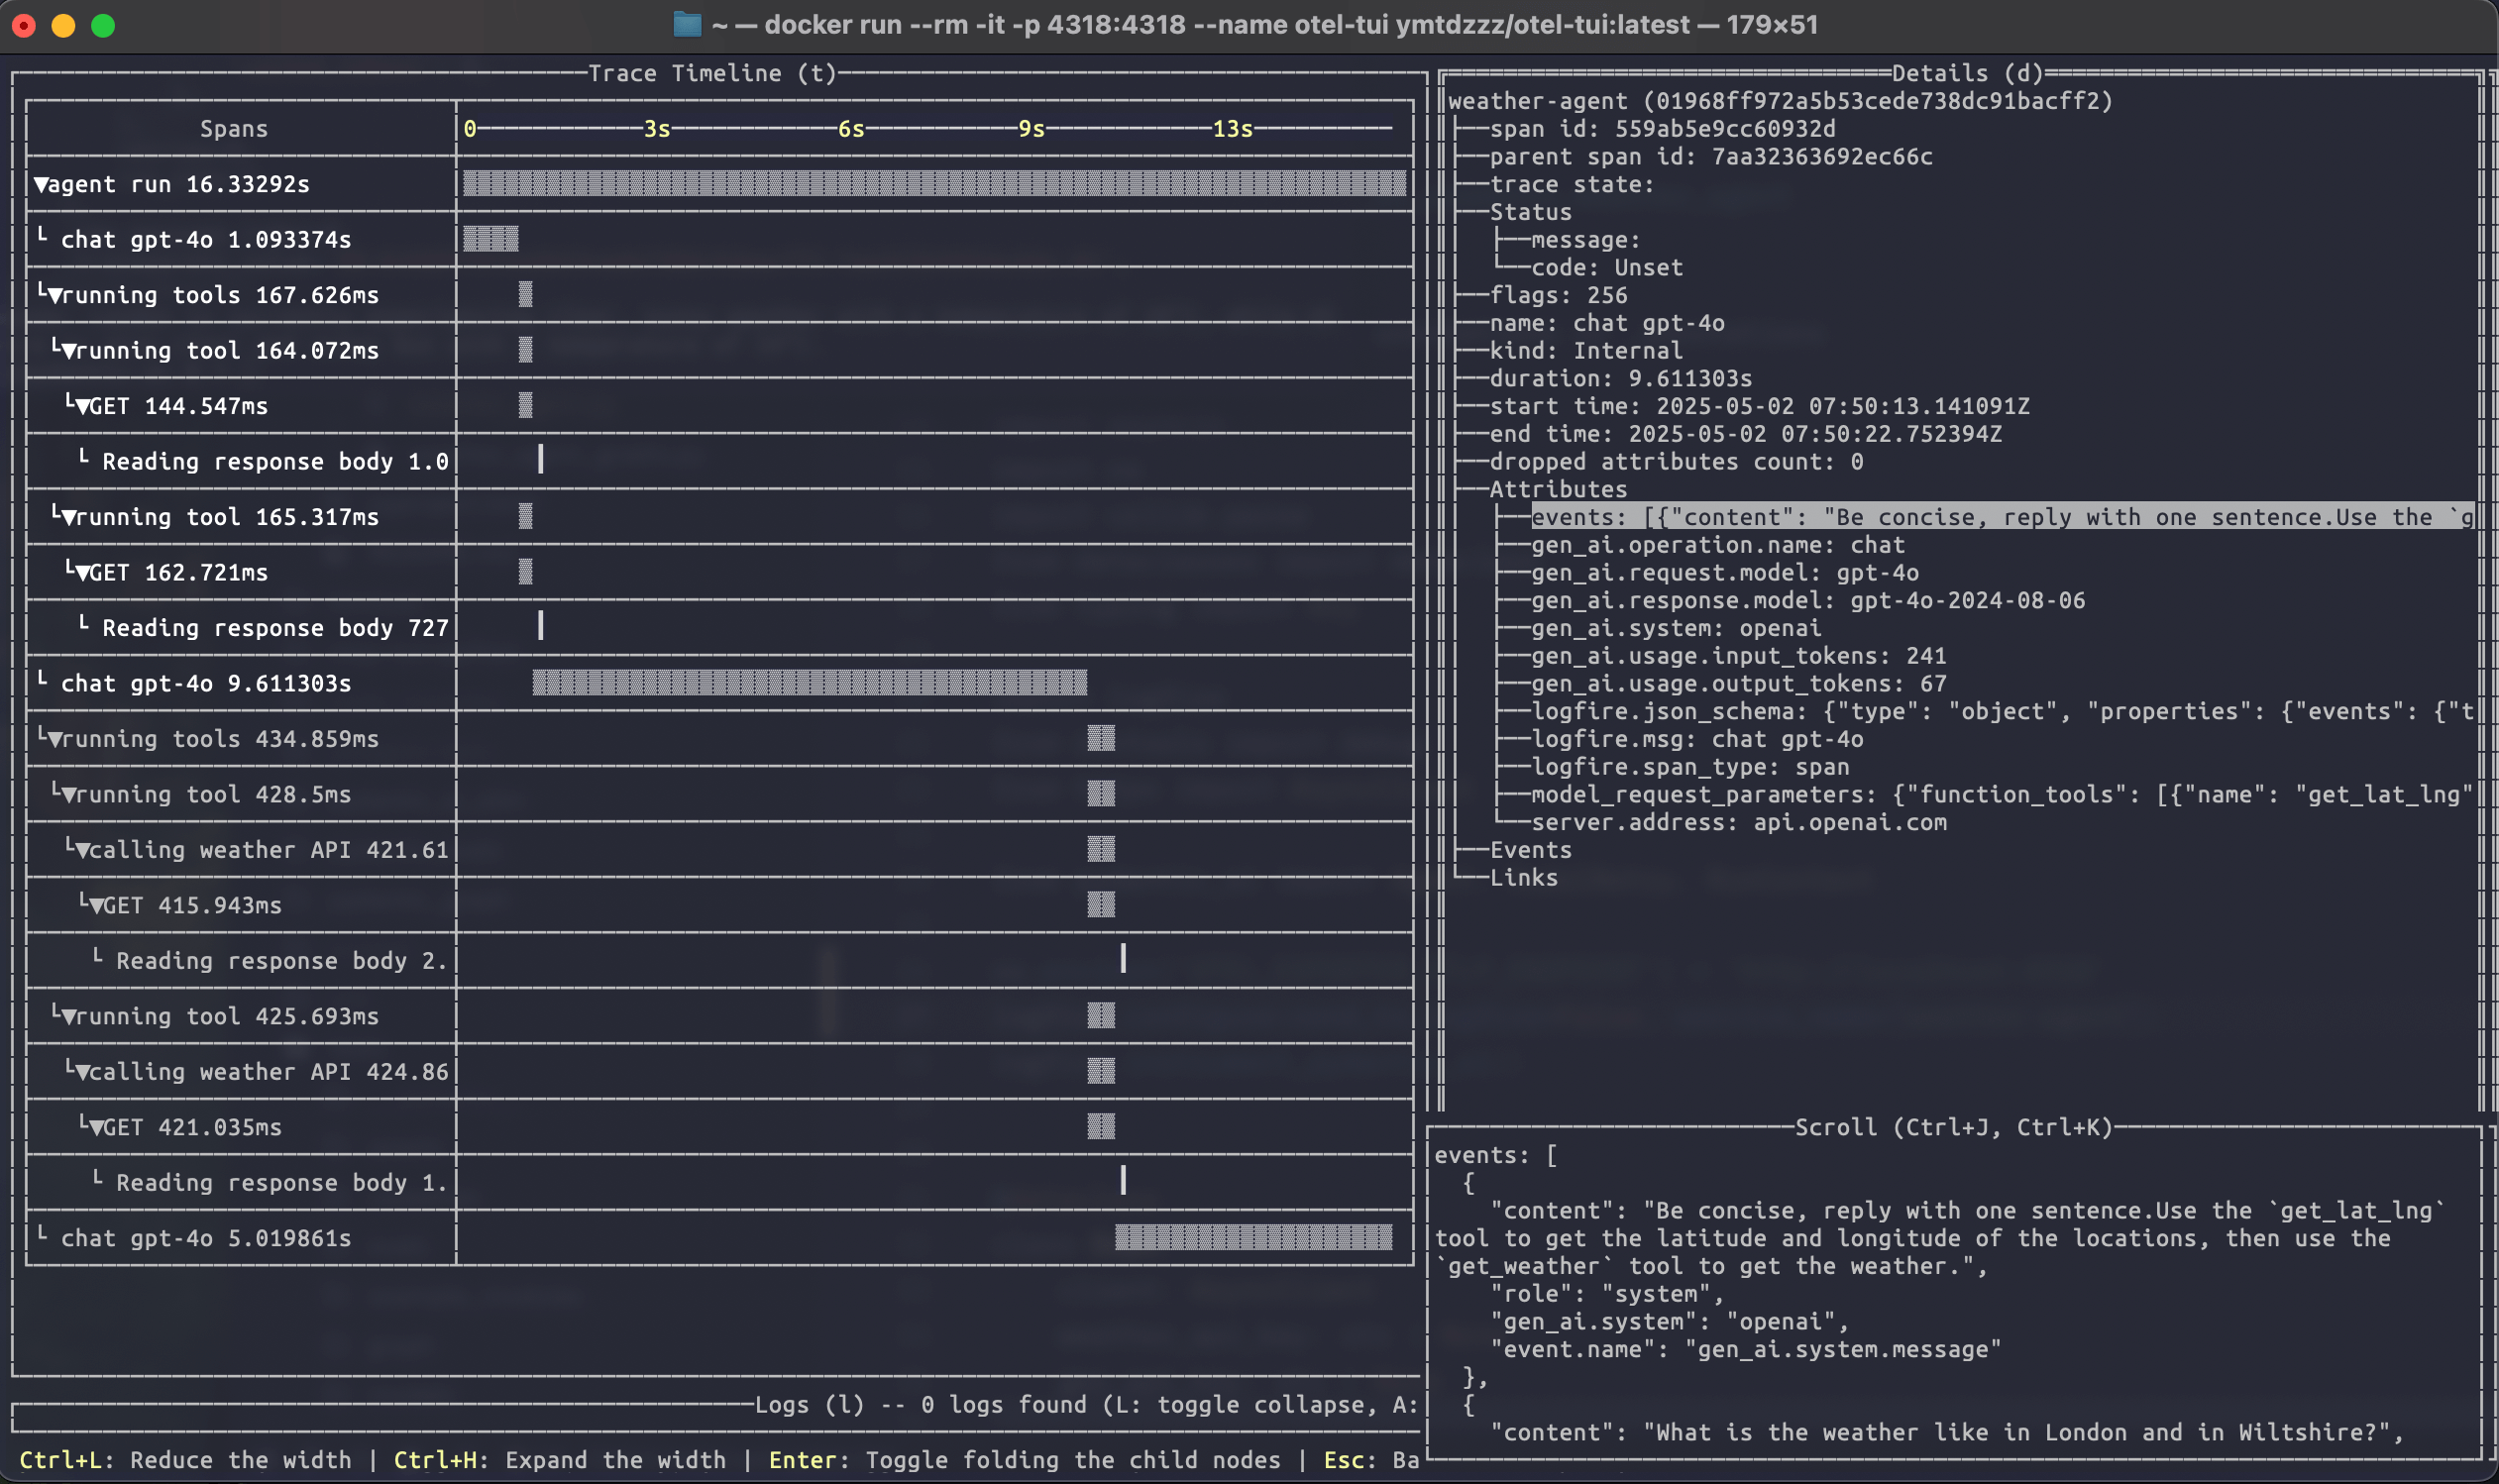
Running the weather agent example connected to otel-tui shows how it can be used to visualise a more complex trace:
For more information on using the logfire SDK to send data to alternative backends, see the logfire documentation.
OTel without logfire
You can also emit OpenTelemetry data from PydanticAI without using logfire at all.
To do this, you'll need to install and configure the OpenTelemetry packages you need. To run the following examples, use
uv run \
  --with 'pydantic-ai-slim[openai]' \
  --with opentelemetry-sdk \
  --with opentelemetry-exporter-otlp \
  raw_otel.py
import os

from opentelemetry.exporter.otlp.proto.http.trace_exporter import OTLPSpanExporter
from opentelemetry.sdk.trace import TracerProvider
from opentelemetry.sdk.trace.export import BatchSpanProcessor

from pydantic_ai.agent import Agent
from pydantic_ai.models.instrumented import InstrumentationSettings

os.environ['OTEL_EXPORTER_OTLP_ENDPOINT'] = 'http://localhost:4318'
exporter = OTLPSpanExporter()
span_processor = BatchSpanProcessor(exporter)
tracer_provider = TracerProvider()
tracer_provider.add_span_processor(span_processor)

Agent.instrument_all(InstrumentationSettings(tracer_provider=tracer_provider))
agent = Agent('openai:gpt-4o')
result = agent.run_sync('What is the capital of France?')
print(result.output)
#> Paris
Data format
PydanticAI follows the OpenTelemetry Semantic Conventions for Generative AI systems, with one caveat. The semantic conventions specify that messages should be captured as individual events (logs) that are children of the request span. By default, PydanticAI instead collects these events into a JSON array which is set as a single large attribute called events on the request span. To change this, use InstrumentationSettings(event_mode='logs').
import logfire

from pydantic_ai import Agent
from pydantic_ai.agent import InstrumentationSettings

logfire.configure()
Agent.instrument_all(InstrumentationSettings(event_mode='logs'))
agent = Agent('openai:gpt-4o')
result = agent.run_sync('What is the capital of France?')
print(result.output)
#> Paris
For now, this won't look as good in the Logfire UI, but we're working on it.
If you have very long conversations, the events span attribute may be truncated. Using event_mode='logs' will help avoid this issue.
Note that the OpenTelemetry Semantic Conventions are still experimental and are likely to change.
Setting OpenTelemetry SDK providers
By default, the global TracerProvider and EventLoggerProvider are used. These are set automatically by logfire.configure(). They can also be set by the set_tracer_provider and set_event_logger_provider functions in the OpenTelemetry Python SDK. You can set custom providers with InstrumentationSettings.
from opentelemetry.sdk._events import EventLoggerProvider
from opentelemetry.sdk.trace import TracerProvider

from pydantic_ai.agent import InstrumentationSettings

instrumentation_settings = InstrumentationSettings(
    tracer_provider=TracerProvider(),
    event_logger_provider=EventLoggerProvider(),
)
Instrumenting a specific Model
from pydantic_ai import Agent
from pydantic_ai.models.instrumented import InstrumentationSettings, InstrumentedModel

settings = InstrumentationSettings()
model = InstrumentedModel('gpt-4o', settings)
agent = Agent(model)